Power BI, Google Sheets and BigQuery – Do they work together?

Power BI, Google Sheets and BigQuery – Do they work together?

Hi Again! I’m back with another post on BigQuery, Power BI and Google Sheets. Today, we’ll be looking at how to connect Power BI and Google Sheets.

Ideally, I’d want to create a DirectQuery connection between Power BI and Google Sheets, because the data in my Google spreadsheet changes frequently, and we need the latest data to be reflected in the Power BI report. Unfortunately, Power BI doesn’t currently support a DirectQuery connection to Google Sheets.

This is where BigQuery will help us out. We’ll try to use BigQuery as an intermediary to connect Power BI to Google Sheets and access the data we need in the way we need it. We’ll need to explore creating a DirectQuery connection between Power BI and an external table on BigQuery.

What is a Direct Query Connection?

Power BI offers different ways to connect to its data sources – Import, DirectQuery and Live connection. A DirectQuery Connection is when the data isn’t stored in the Power BI Server but in the data source itself. Every time you refresh the report, it queries the data from the source and gets it.

Power BI recommends that it’s best to use the ‘Import’ connection whenever possible. However, if we have data changes frequently and reports that must reflect the latest data, then DirectQuery fits best. Performance might take a small hit, but it becomes essential when dealing with huge datasets which can’t be imported to Power BI.

Data sources which allow for direct connections are Google BigQuery, SQL Server, Azure Data Lake etc., You can find more information about Power BI supported data sources here.

What is an External table?

Google BigQuery has two ways in which it stores its data:

  1. Native Table – this is where the data gets imported and is loaded into BigQuery or a table is created in BigQuery and data is inserted. This consumes storage on BQ
  2. External Table – this is where the data doesn’t get imported but stays in the source. This table is linked to the data source and it gets the data every time the associated BigQuery table is queried. This doesn’t consume storage on BQ

Any data which is stored on Google Drive can only be accessed as an external table on BigQuery and this goes for Google sheets as well.

Time for some Action!

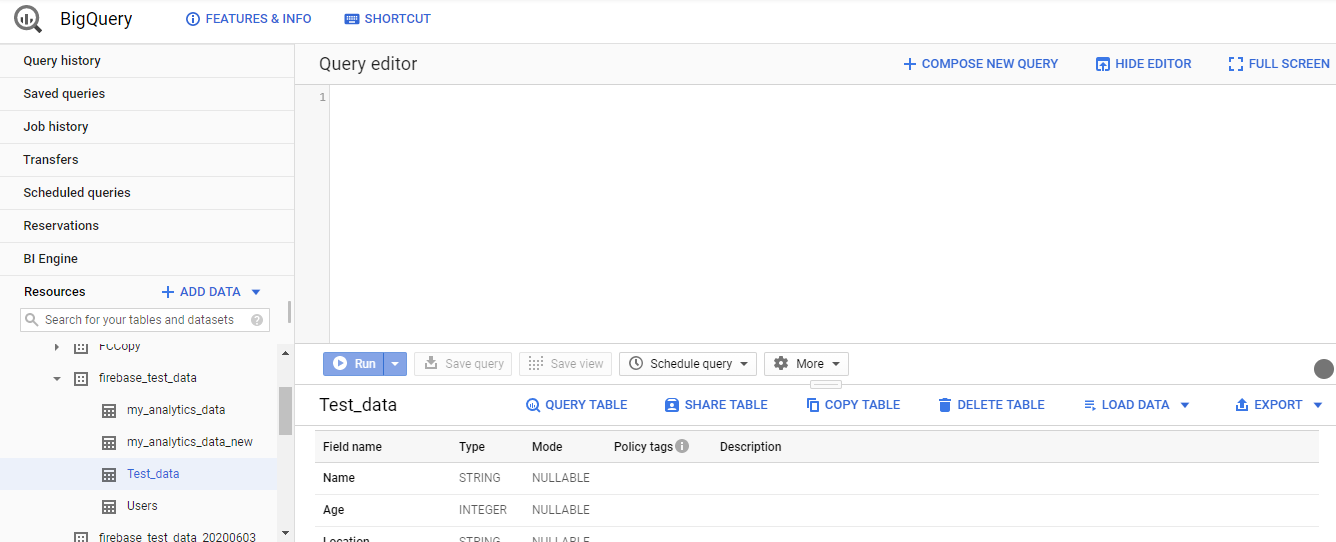
I have a Google spreadsheet named ‘Test_data’ on my Google Drive. I’ll load this spreadsheet to BigQuery using the web console.

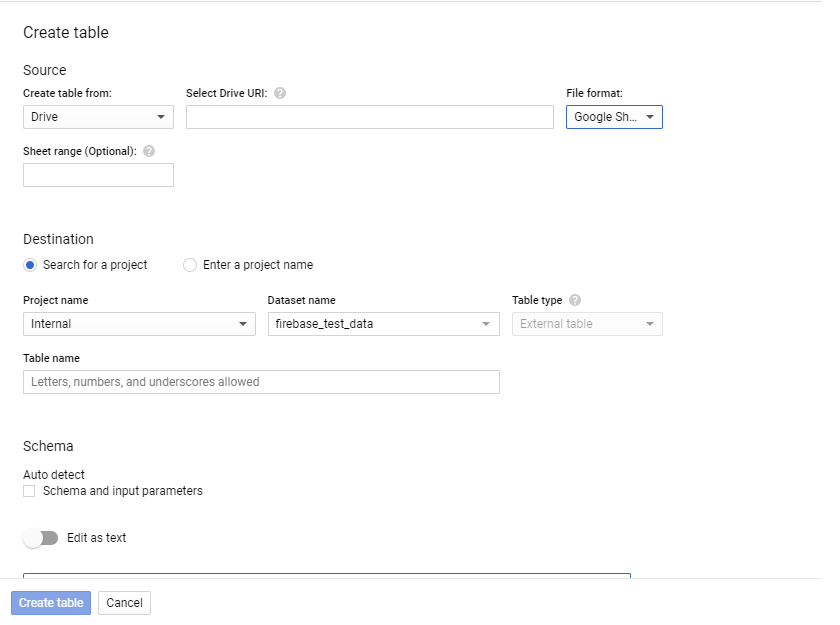
I’ll presume that you have a BigQuery account, a project and a dataset to use for this exercise. Pick a dataset and click on the ‘Create Table’ option. You’ll then be presented with a screen like below. Fill in the details and your BQ external table is ready.
Power BI, Google Sheets and BigQuery

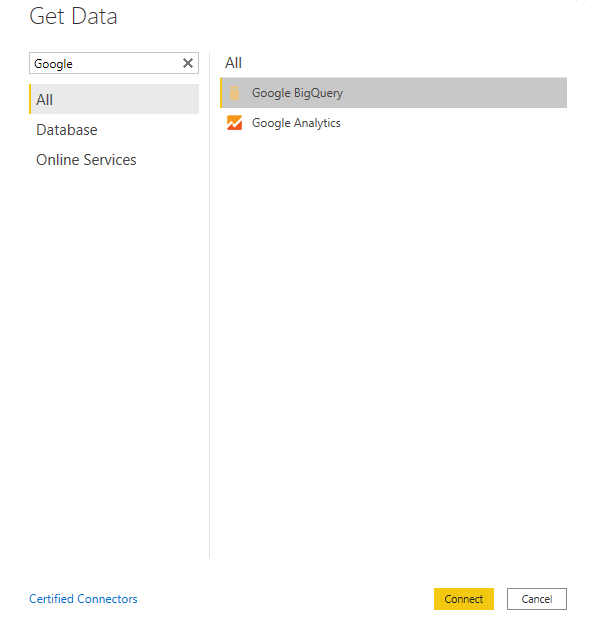
Now it’s time to test the DirectQuery connection in Power BI. So, open Power BI and click on the ‘Get Data’ option. Select the ‘Google Big Query’ and click ‘Connect’. In the resulting window, navigate to the dataset containing the ‘Test_data’ table
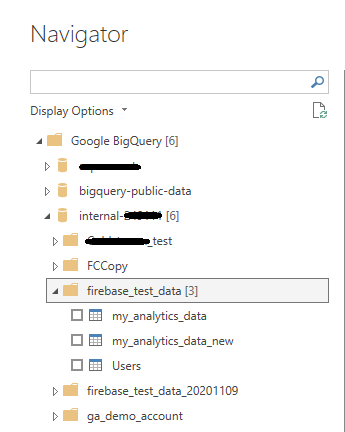
Well, that’s strange! I had 4 tables in my dataset but I can only view 3 of them. This is because the Power BI Google BigQuery Connector doesn’t support External BigQuery tables. It only supports the Native BigQuery tables. Since Test_data is an external table, it doesn’t get listed here.

This information is not mentioned in the Power BI documentation for Google BigQuery either. So, we’ll have to look at alternative ways to get that data.

Is there a workaround?

Yes. We’ll have to convert our External table into a Native table on BigQuery so that Power BI can access it. Let’s look at how to do get this done.

Creating a new BigQuery table

This can be done on the BQ web console with a DDL statement. Here it goes

CREATE TABLE `project_name.dataset_name.Test_data_NEW`

AS SELECT * FROM `project_NAME.DATASET_NAME.TEST_DATA`

The above statement creates a new table named ‘Test_data_new’ and copies the data from ‘Test_data’ table onto it. Now we have a Native table in BigQuery containing the google spreadsheet data.

It’s also possible to write a scheduled query and update the Native table on a recurring basis once it has been created. Note that the minimum time that BigQuery allows you to refresh a table is at 15 minutes. So, with this solution, your report gets updated data every 15 minutes. You could use the below query to get started.

INSERT `project_name.dataset_name.Test_data_NEW`(Name, AGE, LOCATION)

SELECT * FROM `project_NAME.DATASET_NAME.TEST_DATA`

Connecting to Power BI

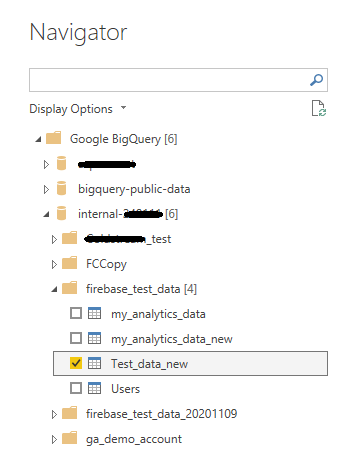
Let’s retrace our steps. Open Power BI and click on the ‘Get Data’ option. Search for Google BigQuery and select it. Once it opens up, navigate to your new table (Test_data_new) and click on the Load button.
Power BI, Google Sheets and BigQuery

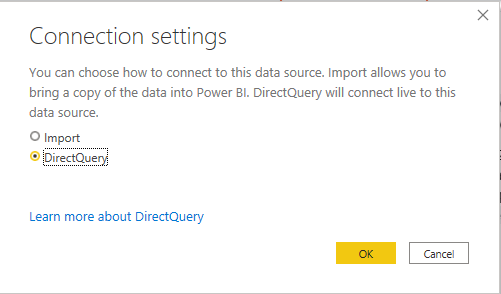
You’ll then be presented with a Connecting settings window, where you need to select the DirectQuery option and click OK.
Power BI, Google Sheets and BigQuery

There you go! I can finally access my Google spreadsheets data in Power BI and the report gets updated data every 15 minutes. Now, that is a perfect solution to this problem. Please feel free to ask any questions by contacting me through the contact box!

Cloud Services: How to Choose between Azure and AWS

Cloud Services: How to Choose between Azure and AWS

Cloud services are now the default choice for all firms. The economies of scale available to the cloud service providers make this the most efficient way to provide storage and cloud computing capacity. Customers now pay for services based on capacity and usage and capacity can be scaled as required.

Management of cloud services costs can now be based on business value judgements. What is the business value of the data we are buying, storing and processing and is it greater than the costs? Cost control is a simple matter of rationalising, or archiving, unused data and checking that any processing adds value. This business transparency simplifies the management of IT costs, not least by making them variable, traceable and comparable across business units.

There are three big cloud services platforms provided respectively by Microsoft, Amazon and Google which have a complete set of service offerings, other platforms with partial service offerings such as Salesforce and Adobe and smaller players that offer only infrastructure as a service. In many service areas “platforms” are being built by acquisition to broaden a core service as the platform strategy is adopted more widely to lock in business customers. This means that any choice of an individual technology is also a platform choice that could have longer term implications.

Amazon Web Services and Microsoft Azure are at the heart of the Amazon and Microsoft platforms respectively, offering services in computing, delivery, storage, database, developer tools, and other functionality.

What is Azure?

Microsoft Azure was launched in 2010. Azure data analytics is a key offering along with solutions for web and mobile applications that can integrate seamlessly with the enterprise environment to achieve efficiency.

Pros

  • High-end testing capabilities. There are testing tools for mobile apps, digital marketing, IoT devices and business apps.
  • Azure has a private cloud computing environment and does not share access to third-party cloud platforms. This feature makes it an excellent choice as platform-as-a service.
  • Azure has autoscaling options ensuring an Azure developer has the capacity required.
  • As a Microsoft offering, it integrates optimally with other Microsoft products such as Windows Server, Active Directory and so on.

Cons

  • Azure documentation isn’t very easy to navigate and sometimes incomplete or not updated. This is often listed as a complaint in Azure forums.
  • Azure’s integration with platforms other than Microsoft is limited.

What is AWS?

AWS was also launched in 2010 and provides tiered cloud development platforms for usage for content delivery and computation. AWS offers several hundred platforms that cover a wide range of solutions in storage, networking, and delivery, with hundreds of templates in several programming languages.

Pros

  • Enterprise friendly, scalable services that offer great flexibility for high-end computing. Subscribers with the pay as you go feature are able to purchase only the required functionality.
  • Covers almost all the cloud services an organization may need. There are several application development platforms that offer dedicated solutions with a unique hardware setup for each.
  • A high level of security is offered in the cloud applications with strict management policies, configuration settings and multiple encryption layers.
  • Autoscaling ensure AWS developers have the resources they require.

Cons

  • The hybrid structure of AWS can be a setback for certain cloud computing solutions as they integrate private and third-party public clouds frameworks.
  • Complexity: An extensive list of services and high-quality resource offerings means AWS developers require a more elaborate knowledge of the environment.

Comparative study of Azure and AWS

The table below compares the key features of Azure and AWS and highlights some key differences.

  Azure AWS
Computation Virtual Hard Disk that is equivalent to a Machine instance, is used for computation through virtual machines. The user, Microsoft or third-party can pre-configure the VHD. EC2 users can configure their virtual machines or use pre-configured machine images for computation. The user can choose the size, power, memory, regions, and zones to launch.
Storage

Storage Block Blobs are used for storage that consists of blocks and large Blobs are uploaded efficiently. Cool and Archive access tiers of Azure blob storage allow for data archiving.


Has temporary storage that is created once an instance begins and destroyed when it ends. There is also block storage that can be attached or separated from an instance. Object Storage is offered with S3 and data archiving services with Glacier. Support for relational, NoSQL databases and Big Data is provided.
Networking A virtual network is used for networking and content delivery. VPN gateway is used for cross-premises connectivity. Load balancer and application gateway are used for load balancing. Networking is provided by various partners and networks that interconnect with data centres using different products. A virtual private cloud is used for networking and API is used for cross-premises connectivity. Elastic load balancing is used to balance network load.
Integration Native integration is offered for VBS, SQL database, Active Directory. Works well with .Net as well. There aren’t many open source integrations but supports Linux and Hadoop clusters There are open source integrations available with AWS such as GitHub and Jenkins. It works well with Linux servers as well.
Ease of Use Easier to adopt for Windows platform users. Simple to integrate cloud instances with Windows servers and create a hybrid environment. User friendly interface, diverse array of features, well-documented, offers flexibility and customisation
Pricing Pay as you go model but charge per minute. Short term plans are offered with options of pre-paid and monthly charges. Pay as you go model charged per hour of usage. Instances can be purchased in some circumstances.

Conclusions

Ultimately, the choice between them is a platform choice. Some firms see themselves as committed to the Windows and Microsoft platform, are comfortable with the easy interoperability of all the tools in the Microsoft platform and not dismayed by any lack of interoperability with other best of breed tools.

Amazon is chosen by firms which are primarily looking for a technical edge in infrastructure as a service and are prepared to look more widely for complementary best of breed tools and to invest more effort in extracting advantages from them.

Whichever provider you choose, you will be reaping the benefits of a highly scalable cloud solution that can cater to the ever-fluctuating business requirements.

CFO’s Guide to Using Algorithms

CFO’s Guide to Using Algorithms

You already make decisions using common-sense and data. Algorithms help by making it practical to use a lot more data. – if you have it. The logic behind the decisions, with or without algorithms, is often the same.  

For example, you already make decisions and predictions based on your understanding of relationships like the causal relationships between your sales spend and sales volume. You already try to understand your customers by grouping them together into segments based on similarity or differences – perhaps on their propensity to spend or their preferences – so that you can treat them appropriately. Perhaps by sending them different messages, messages that will resonate more.

If you have the data, algorithms can process it in a reasonable time to come up with a better understanding of relationships and better groupings (classifications) – perhaps by revealing patterns that you were not aware of before.

Commonplace Examples

Predictions

If you want to predict what sales will be next year, then you could assume that there is a direct relationship between sales and the spend on salespeople. If you are increasing the numbers of salespeople you could predict a corresponding increase in sales, with some adjustment for ramping up. If you want to consider more factors, then you might want to assess the relative importance of investments in marketing, customer service, trade discounts and revenue growth management activity. Algorithms use data on relationships between these factors and sales to make a sales prediction. Such approaches can help create powerful marketing data analytics and sales analytics.

Ranking Prospects

If you wanted to identify where to focus the attention of your B2B salesforce then you could simply assume that company size is the best predictor of potential and rank prospects for your sales team in order of their prospects’ annual sales turnover.

If you want to consider more features than just turnover size, then you would want to use your understanding of current key accounts to check which other features are relevant and produce meaningful sales analytics. For example, does industry sector affect sales to customers, does growth rate, does turnover per employee? Algorithms use data to check these relationships for significance and group customers accordingly.

Now you could group new prospects on how similar they are to these groups of existing customers. If you assemble data on a hundred thousand companies, many that your salespeople will know nothing about, you can use an algorithm to group and prioritise them efficiently by similarity with your current best customers.

Relationship Algorithms

Relationship algorithms base their predictions on the relationships between values using mathematical methods (e.g. regression, Markov chains).

Clickstream Analytics

Clickstream analytics tracks relationships between clicks – in what sequences or chains of clicks do people click through the pages of your website? One click leads to another and so each click has a certain probability of following another. You can predict the likelihood of the next click.  For marketing purposes, you can cluster clickstreams to identify different types of users following different paths – assigning different personas to these paths. You can do clickstream analysis in real time, (using tools that work on data steams) to predict visitor clicks and decide which ads or messages should be shown to the visitor next.

Credit and Liquidity Risk

In lending, you can use relationship methods to predict a probability of default and price the risk better. You can use relationship methods on quite complex scenarios, for example, in banking, what are the chances of a combination of related events occurring such that a bank runs out of cash?

Classification Algorithms

Grouping algorithms use a mathematical process called classification. There are different algorithms to use depending on complexity. Clustering algorithms help you explore and organize data (K-means and support vector machines) – dividing your data up into like groups. Some make allocations based on decision trees (e.g. random forest) making an allocation decision at each node in the tree.  You can use classification methods to answer similarity questions like: “is this prospect in the high potential group or the low potential group?” As a lender you can also use classification to identify customers who are a credit risk based on their similarities with past defaulters.

Dynamic Segmentation

You can find new ways to define customer segments, grouping them together on the features that are shown by the data to be significant for your business. Not just from their demographics but using all the data that you have on them and their behaviour; including when they visit your website, communicate with you, or buy from you.

Customer Churn Predictive Analytics

You can use classification methods to predict when customers are going to stop doing business with you, by their similarities in behaviour or situation with other customers who churned – so you can intervene to stop them – dealing with the underlying service issue or making them a new offer.

Predictive Maintenance

You can use classification to predict when a machine is at risk of breaking down, based on patterns of machine operation that are similar to those preceding previous breakdowns.

Visual Recognition

There are algorithms that can classify images based on their similarity to other images, so they can answer questions like; is this circuit board OK or not OK?

Fraud Detection

There are also algorithms to identify anomalies or outliers in data, for example for checking for anomalous transactions that don’t fall into the “normal” group to help to detect fraud.

Recommendations

There are algorithms to generate recommendations based on similarities in people’s demonstrated preferences. For retailers, this is groups of products that are often bought together.

Bundle Pricing

You can use your data on products which are often bought separately to predict the discount that will sell the goods as a bundle and increase profit.

Matching Algorithms

Propensity to Consume

There are matching algorithms that estimate the propensity of someone to buy a specific product, (or, in medicine, to respond to a specific treatment).

Text Matching

There are algorithms that can match text, classify documents accordingly, and transform textual data into a more useful format.

Conclusion – Choosing Algorithms

Choosing algorithms is common-sense. If you have the data, they can add greater understanding and validation to your decision-making. Compare these example cases to what you want to achieve. Express what you want to do in a way that algorithms can address. Then there will be obvious algorithms to choose from. Try them out to see which algorithm works best. There are practical trade-offs between data volume, processing time and cost, accuracy, bias, speed and efficiency and you will only discover the optimal solution by iterating through the options. You will see where you have enough data and where you don’t. You will be able to assess the value that sourcing additional data might have.

CFO’s Guide to Investing in Web Analytics

CFO’s Guide to Investing in Web Analytics

Introduction – Engaging Your Web Audience

This note is for the CFOs of firms with a web presence and would like an outline roadmap for investing in that presence and the associated analytics. It is not addressed to people in digitally led, consumer-oriented businesses for whom digital is a strategic concern who will find other useful resources on this site. This note is to help you think ahead about how you might develop your web presence, identify and address your target audience, to the point at which you will want to bring together data on the people you engage with digitally and in person.

Website Analytics

Every business with a web presence begins with setting up a basic website. It is cheap and setting up the analytics for it is also cheap. There are tools like Google Analytics (GA), MixPanel or Adobe Analytics that you can connect to your website. Each tool has a wizard to help you connect. It connects to your website by inserting tracking code on the pages. The tracking code sends back data, that can then be analysed in analytics tools, such as Google Data Studio, Power BI or Tableau. If your visitors agree you can set up cookies so you can gather data on their individual activity and interests.

For a basic website you may be interested in basic information, for example, how many visitors you have, how they found you, and how many of those visitors return, which pages they visit and how long they spend on those pages. Essentially you can see how many people are checking you out and can assess the level of interest in you and your business.  

Analytics for Content-rich Websites

However, Google Analytics can analyse a lot more than these basic measures. And this will be important if you are using your website actively to attract business. To attract visitors, you might be investing in creating relevant content so that visitors will find when they search for information. You might be investing in AdWords, in paid search, to stand out from the crowd and alert people to your relevant content. You might get visitors to share their contact details with you. You can set up Google Analytics to work out how your investments in attracting visitors might be paying off.  This requires some thought about your goals and how to measure how well you are performing against them. (It also helps in analysis if you make sure that you are using a logical structure for the URLs of your content pages, so similar pages can be grouped together.)

Google Search Console

You can also install Google Console on your site, which is also free, and this includes Search Analytics which helps you see, among other things which search terms (keywords) that visitors are using when they find your site in the search engine results page. You will also be able to use Google Search Console to check that your site content is easy to find.

Investing in Content and AdWords

You are competing for people’s attention. There is no substitute for investing in the quality and relevance of your content and in quality advertising. For example, high cost AdWords are expensive because they are effective. Data analytics will help you to compete effectively and check that you are getting what you are paying for, and an expert internal team or data analytics consultancy can easily set this up.

Analytics and Tagging

If you would like to see in more detail how people are engaging with your content and perhaps downloading documents, then that will require investments in more sophisticated tracking of visitors’ activity and actions. This is done by “tagging” elements of the website with snippets of code so that when the visitor clicks on a tag this triggers the sending of data to Google Analytics. You will need the services of an experienced developer to set up the tagging. The developer will use Google Tag Manager (GTM), a tool that assists with the task of adding Java code snippets using GTM tags which Google has pre-validated. Google Tag Manager coverage of tagging requirements improves continuously and GTM could already cover most, if not all, of your tagging requirements. Where it does not, custom code/plugins are also available on GitHub to an experienced Java developer.

More extensive tracking is usually only required if you sell products, either digital or physical from your website (This might include branded promotional goods for example). This requires the tracking of transaction information. This has three elements; data about the transaction (held in a central repository or data layer), a tag for the transaction and a trigger to bundle and send the data about the transaction to Google Analytics. GA is readied to accept the data by enabling the Google E-commerce plug-in within GA settings.

There is a more advanced plug-in that helps to give better information about the shopping behaviour of visitors to the site and a more extensive range of reports on the purchasing funnel. (For example, enhanced e-commerce provides more tagging options around shopping carts, promotions, discounts and check-out behaviour than standard e-commerce and has additional standard reports.)

Even if you don’t want to sell on your site, you can “hack” the enhanced the e-commerce tracking plug-ins and use the standard funnel reports to give more information about the “funnels” visitors move through on your site and how engaged they are with your content.

If you seek to attract customers through display advertising, you may also use automated platforms, to push ads to your target audience. These take only milliseconds to identify a high value prospect online from data, complete a bidding transaction and select and display your ad. Then you will also get data returned from the platform on the performance of your advertising.

If you are spending advertising money through multiple media channels, then you will need to bring together data on spend on, for example, social media, electronic media, print, TV and radio and to have a method of attributing the value of the business you are generating to your spend in each of these channels.

The more important your web presence and web reputation, then the more important it becomes to listen. Social media and web monitoring services will tell you what people are saying about your company and your brands online. And give you time to respond. Generating another source of data.

You will wish to combine web data with your other data on customers and prospective customers from your CRM and financial systems. Bear this data integration step in mind and keep all this data compatible with shared data disciplines across responsibility areas. Make sure people in different functions use the same identifiers for critical data elements like the names of customers, prospects and campaigns across all channels and systems otherwise you will have an extra mapping task to do when combining the data.

At this point, data from media, social media and web sources has become just another element of your data strategy and your use of analytics, data science and AI. You might want to check out our White paper on Analytics, Data Science and AI or our blog Guide to investments in data analytics and digital.

Conclusion

Though this note has been addressed to businesses that currently are neither strongly digitally led nor consumer oriented, the use of digital media continues to grow strongly. It is hard to overstate the potential for a firm to use digital channels to have “conversations” with its audience.  In the direct to consumer sector, such “conversations” with consumers have been the basis for product and brand innovations that have rocked some of the big established brands. There may be more opportunities for your firm in increased digitisation and digital data that you would like to explore. For some firms, digital and web analytics have been the foundation on which to evolve a broader data strategy and digital strategy including the application of data science and AI to data from all sources.

CFO’s Guide to Investing in Marketing Automation

CFO’s Guide to Investing in Marketing Automation

There are more than a thousand different digital marketing automation tools available. There are few entry barriers into the digital marketing technology business. The underlying technology is cheap, the skills are readily available in the global gig economy, it is easy to scale, and the risks are low. So, the number of firms competing in this sector has grown rapidly. Prices are highly competitive.

However, a hidden cost in these tools is the cost of integrating the data from each of them. Recently, we’ve been helping firms find “work arounds” to enable them to access their data from highly inaccessible tools. Their frustration is significant: After all the investments and efforts they have made in their digital marketing initiatives, they now find that they can’t easily access the data they need to make decisions, tune their approach and understand what’s working and what isn’t. A frustrating situation that can be avoided by appropriately selecting marketing tools and having a cohesive data strategy.

 So, when your firm is making a choice of marketing automation tools, screen them first on one simple criterion. “Is it easy to extract my data in a suitable format and combine it with data from all my other marketing sources”.  If not, then that tool will be undermining the biggest advantage of digital marketing, the ability to interrogate data in order to optimise marketing spend. A poor choice will mean that you will waste money on data integration and/or will have poor analytics that lead to wasteful marketing spend.

The care that a marketing automation tool has taken to ensure that users have painless access to their own data is an important guide to the quality of the design. If the tool has an inadequate or poorly supported API or application programming interface, used to extract the data, avoid it. It will handicap your digital marketing efforts

However, if you can get out the data you need, even as a csv or Excel file, then you will always be able to automate the transformation with generic tools and load your data into a cheap cloud database; you will build a valuable data asset and be able to apply any data analytics tool you wish. You will have a cost-effective digital marketing data strategy that will scale with your business – not a poor strategy that will handicap your firm.

The problem is prevalent enough for a new industry to have sprung up that offers connectors to help you extract data. If you have made a poor choice, then these will be your best option – at a price. Why put yourself in the position of needing them in the first place?

Given the fragmentation, sector consolidation is in progress, and proprietary marketing platforms are available that offer both data and analytics tools. For these options consider that they have your data, not you, and that the future license costs will reflect that fact that you will be locked in by the cost of switching away from the platform.

An alternative strategy that puts the data in your teams hands, gives you the freedom to use the best analytics tools, gives you the best chance of creating intuitive analytics and that supports the sort of creative and innovative marketing that will help your firm stand out. Having marketing data analytics, that is purpose built and meaningful to your team, will drive that differentiation. You can do this with an internal team of data experts, an external data analytics specialist or by upskilling team members with assistance from a data strategy consulting firm.

As digital marketing is an area where returns compound over time, the decision to invest in marketing automation is strategic. This means that it is best approached with a view to the longer-term development of a cost-effective data strategy and to the development of valuable data assets, not for the sake of short-term expediency.

CFO’S guide to Investment in Brands and Channels

CFO’S guide to Investment in Brands and Channels

If you’re the CFO of a consumer business, it’s likely your business is becoming increasingly multi-channelYour role in balancing investments between these channels and investments in brands is therefore increasingly demanding. Understanding the trade-offs between the investments in brands and investments in the retail channels that help reach consumers, is ever more challenging. 

Investments in digital marketing will help build important strategic assets, such as brand equity and consumer intelligence. But the same brand equity risks being undermined by the channels you are investing in, as they are also competing for brand equity and share. 

So, what are the trade-offs in each channel and how do we understand and manage them to optimise our investments? 

Channels  

For a long time, brands have both cooperated and competed with channels; multi-channel business is more complicated. Each channel creates different challenges for the brand owner:  

  • Some are opportunities to build brands 
  • Most create short term returns 
  • Some carry the risk of undermining the brand and eroding margin 
  • Some are the source of crucial consumer intelligence 

Each channel generates different data and if we want to manage our brand and channel strategies effectively, we must be able to look at our channel data and digital marketing data together and apply some suitable analytics. Doing so will allow us to understand and manage channel relationships.  

The challenges in each channel are unique, so let’s take a look at some of them.  

E-Commerce Retailers  

These offer reach to brand owners. Amazon is reaching nearly 197 million unique visitors per month, but offers little influence over assortment, pricing, or presentation. Although for big brands it is possible to embed brand teams with Amazon which can help to optimise brand visibility criteria, position on the webpage, customise the brand presentation and understand the impact of competing brands.   

Brands, however, cannot be built in this channel. Dynamic pricing and price erosion will undermine brands with premium positioning. Monitoring presentation, pricing, share and margin data are critical to analysing the risks to brand equity. Price data is also needed to analyse the cross-impact on price promotions in any bricks and mortar channel.    

E-Commerce Store-in-store and Online Marketplaces 

More than 150 online marketplaces offer reach, with more control over pricing and presentation than is offered by e-commerce retailers. Each brand can give consumers a stronger brand experience and generate valuable consumer feedback on which to assess brand health and product innovations.   

These channels support consumer dialogues which can have measurable impact on brand health, and which can spill over into other channels, helping to lift brand share and category sales. These marketplaces also offer attractive economies of scale, such as shared fulfilment services to help support margins.   

Some marketplaces have been poor at controlling grey market or parallel trade activity which is a price erosion risk to monitor  

The data captured on performance, pricing, margin, presentation, brand health, consumer sentiment and digital conversations with consumers can be rich and help to produce valuable brand analytics  

Direct to Consumer Websites 

Used initially by established brands to showcase products and engage with consumers these are increasingly being used as direct sales channels. The sites generate not just data on consumer attitudes and relationships but also on purchasing behaviour. The channel offers the ability to collect data from market tests of innovation, pricing and merchandising. These sites also benefit by providing exclusive offers, premium and personalised products to engage consumers, build loyalty and differentiate the channel.  

Direct to consumer websites require considerable investment in content and marketing to drive traffic and develop customer loyalty, so some analytics activity is aimed at optimising site performance against the ranking algorithms of the search engines. However, perhaps more important is measuring the effectiveness of the site in building the brand and consumer loyalty. The ultimate potential of D2C sites and consumer loyalty is perhaps demonstrated by the Apple D2C website which generates substantial revenues.  

New digital-first brands with distinctive offerings also use D2C websites to build relationships and sustain digital conversations with their target segments, permitting them to cut into the share of bigger brands without incurring the costs associated with supporting other channels.  However, such firms usually go on to develop a presence in bricks and mortar channels to enable consumers to experience the product and will see increased conversion rates in all channels as a result. 

 The consumer intelligence that can be accumulated through the digital conversations encouraged by D2C sites is a long-term strategic asset for brands. Both new and established brands have used D2C channels for encouraging users to share ideas for new products and marketing messaging. 

Bricks and Mortar Retail 

Most brands using this channel have established account management processes for negotiating with bricks and mortar retailers over assortment, pricing and presentation. This channel provides consumers with the opportunity to experience products in a way that is not possible online. Store-in-store works for higher margin brands that can support the additional marketing costs. Analysis can indicate how the consumer confidence created in bricks and mortar channels can be shown to influence online conversion rates. Data captured on sales and share are the basis for revenue growth management analytics and for managing the relationship with the retailer using trade profitability analytics. 

Analytics Challenges 

Analytics offers help with managing these complexitiesThe ability to integrate data from multiple sources to measure returns is fundamental. The data is usually integrated within a cloud service such as those provided by Google, Microsoft and AWS as these are eminently scalable and low cost. 

Where analytics services are used it is important that they provide access to raw data via APIs or other interfaces. Data strategy policies should be established that prevent valuable information being rendered inaccessible in any internal or external silo, which would inhibit the development of consumer intelligence as a strategic asset.   

From the CFO’s perspective, expenditures on digital marketing and channels produce both short term returns and create strategic assets – brand equity and consumer intelligence – that are the foundation for future growth.  The investments also involve trade-offs and cross-impacts. By using an integrated approach to analytics, this complexity can be effectively managed.