
Get Actionable Insights
Visual Analytics help business users to understand their data intuitively, share actionable insights and influence decisions.
Effective, well designed dashboards drive performance and align your team behind strategic priorities. Whether you’re an advanced user of visual analytics technologies or just starting out, looking to use open-source tools or one of the industry’s most advanced, we can support you.
Oxi Analytics can support you to:
- Find the tool that works for you
- Design effective analytics
- Roll-out critical dashboards
- Improve dashboard performance
- Incoporate data science models
CONTACT US
Data Visualisation Tools
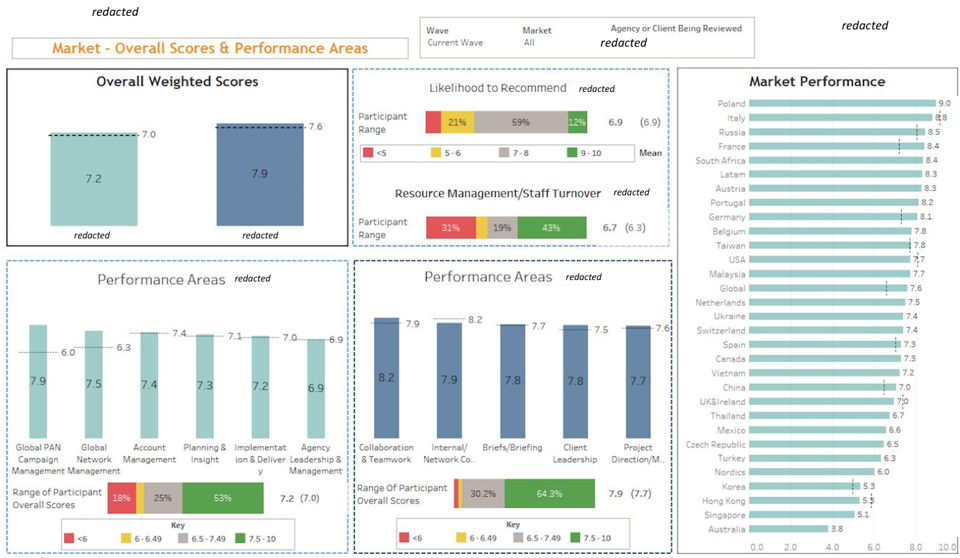
Tableau

Tableau’s business user focused design and rich feature set make it one of the industry’s leading tools for advanced data and business analysis
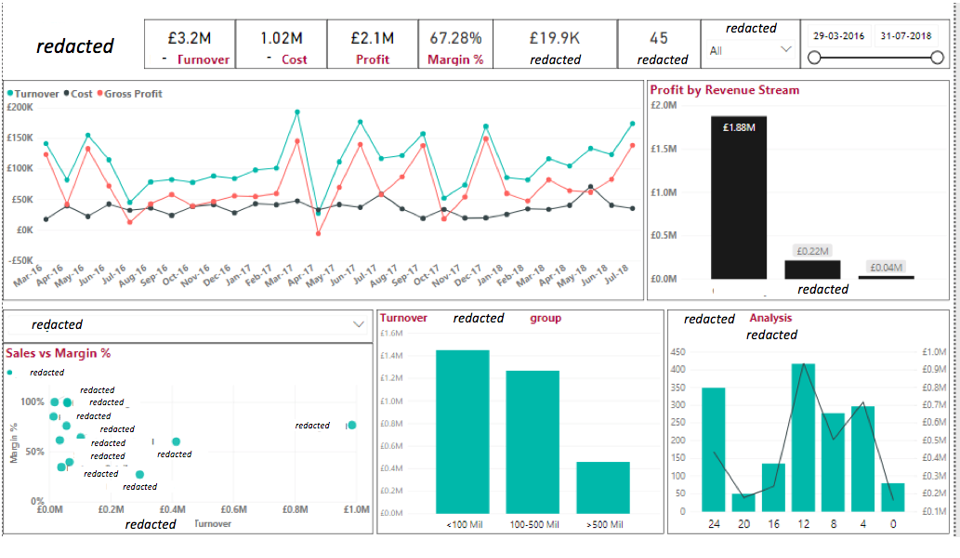
Power BI

Microsoft’s highly cost effective Power BI technology is highly capable and fits in seamlessly with existing Microsoft data technologies
How to Choose an Analytics Tool
The most important criterion for selecting a tool is how easy it is for the people responsible for turning insights into action. There are however, other criteria like longevity, technology fit and cost effectiveness.
We can help you understand which tool will deliver the greatest overall benefits. We have worked with multiple data visualisation tools and dashboard solutions over many years; both in in cloud and on-premises settings.


