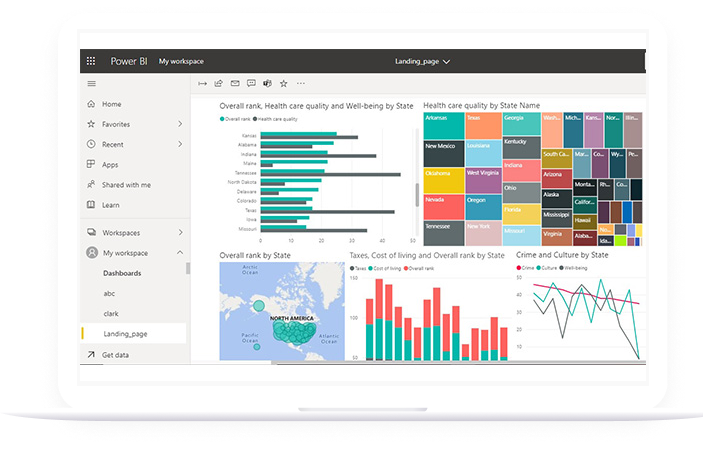
Flexible Power BI Consulting Services Designed To Support Your Goals
Oxi Analytics are Power BI consultants and a Microsoft Gold Partner, with many years of experience. We help businesspeople get more from data analytics than simple reporting. We help people to set up Power BI to create actionable insights and that drive performance and make a positive impact.
We use experience, technical skills and listening closely to clients help design analytics that are best for your purposes. We co-create solutions with you to ensure that they reflect what is important. Broad industry experience helps us to fully understand your business model and aims. Strong technical skills help design data models that are elegant, relevant, performant, easy to understand and easy to use. We help you create the best analytics platform for your business.
We help you develop Power BI dashboards that gain prompt and useful insights into the actions that will make the most difference and find the licensing solution best suited to your needs.

Power BI Consulting
Oxi’s Power BI services are flexible and suit firms that value agility, fast results, quick returns, and low costs. We can meet your immediate Power BI needs quickly. We can supply longer term support for your data analytics journey. Our team has complementary skills and experience in business analytics, data science, data engineering, and data warehousing. So, we can help you place Power BI in the context of a sound data strategy and analytics strategy. We can also help you use Power BI with advanced data science and statistical techniques and take advantage of Power BI as part of the Microsoft cloud services platform. We can help you to:
What is Power BI?
Power BI users are free to connect to many data sources and can integrate data directly within the Power BI data model.
As Microsoft Power BI consultants, we help clients to align their use of Power BI with their data strategy, business priorities and long-term aims. As a Microsoft Gold Partner we help clients who want to use Power BI with other Microsoft data, analytics and automation tools. These could be Azure, Azure Machine Learning, Office 365, Microsoft Forms, Microsoft Flow, Power Automate and Power Apps.

Power BI and Data Sources
To get the most out of your data you need to bring it together. You can connect Power BI to a variety of data sources and merge the data within the Power BI data model. Common data sources include online services like Google Analytics, QuickBooks or Xero. Databases in the cloud include Azure SQL, Redshift or BigQuery. Data sources can be local databases or files on a shared drive.
Oxi Analytics has the experience to solve complex data challenges. We use our technical skills in data engineering, extraction and transformation to solve data problems. Many consultants with skills only in Power BI might struggle with these data issues.
Power BI Licenses
If you would like to understand more about licensing, please feel free to get in touch. Request a call and we will be more than happy to share our thoughts and experience. Find the Power BI license option that will be most cost-effective for you, now and in the long term.
Power BI Use Case: Analysing performance – Power BI Financial Reports
Power BI financial reports and financial analysis communicate priorities across the business. They help align all resources behind them.
Use Power BI to combine financial data with customer, marketing, and operations data, helping financial staff partner with their business colleagues. In partnership, they can work together to improve effectiveness, efficiency and profitability.
FAQs
Is real-time analytics possible in Power BI?
The simple answer is yes, but it is important to understand the use case, as there are limitations depending on what type of real-time data set is being used as the source. Power BI with real-time streaming lets you stream data and update dashboards in real-time. There are three types of real-time datasets – Push datasets, Streaming datasets and PubNub Streaming datasets. Building Power BI reports (including historical data) is only available using Push datasets. The other streaming datasets can display current data, but data is not permanently captured (a stock ticker is an example of this). We discuss below the limitations when using Push datasets. More information on the differences between the three datasets can be found by scrolling down to the section on the Streaming dataset matrix.
When data is captured in a Power BI ‘Push dataset’, Real-time dashboards can be developed. These Power BI reports and dashboards can then be embedded in a webpage providing real-time analytics to the users. One limitation is that the data transformations that can be applied are restricted. It is also not possible to combine the Push dataset with any other dataset in the Power BI data model. So, while real-time analytics is possible in Power BI, it is suitable only for cases where all the data is coming from a single source and the data model doesn’t need too many transformations to get to the visualisations.
How is Power BI licensed?
Power BI can be licensed on a per user basis or a capacity basis. For user based licensing, which is often best suited for SME customers, Power BI Pro is often the best choice.
Capacity based licensing is also available in the form of Power BI Premium, which is usually suitable for larger organisations. There is also an embedded licensing model which is also priced on a capacity basis.
Please contact us if you would like to discuss your licensing requirements and one of our team will be happy to help you find the licensing model that will best suit your use case and budget.
What is the difference between Microsoft Power BI Pro and Premium?
Power BI Pro and Premium represent two different types of Power BI license. Power BI licenses are available per user, whereas Power BI premium has a capacity based pricing model.
Power BI Pro stores content in shared capacity and users need to have Power BI Pro licenses to access it. If content is stored in shared capacity, users who are assigned a Power BI Pro license can collaborate only with other Power BI Pro users. They can consume content shared by other users, publish content to app workspaces, share dashboards, and subscribe to dashboards and reports.
Power BI premium stores content in dedicated capacity. Users with both free license and Pro license can access the Premium content. Premium capacity is assigned to workspaces and not users. Power BI Premium, allows users with a free license to act on content in workspaces that are assigned to Premium capacity. Outside of Premium capacity, a user with a free Power BI license can only use the Power BI service to connect to data and create reports and dashboards in My Workspace. They can’t share content with others or publish content to other workspaces. When workspaces are in Premium capacity, Pro users may distribute content to users who don’t have a Power BI Pro license.
Detailed table with differences between the two subscriptions can be found here upon scrolling down to the Power BI features comparison section.
How much does Power BI cost?
Power BI Pro costs $9.99/month/user. It is a highly cost effective data analytics tool and Power BI Pro licenses will be suitable for a large number of SME customers. There is also a free version of Power BI called Power BI Desktop to create and view reports, but it cannot be published or shared amongst other users. Power BI Premium follows a capacity pricing model rather than a user based licensing model and therefore the cost can only be deduced after consultation, however, the starting cost is $4995 per month and therefore it is usually suited to larger customers, looking for a large scale analytics platform. More information is available on pricing here.
What is Power BI embedded?
Power BI Embedded is an option that allows you to embed dashboards and reports into applications. It is often used by developers who have built applications and want to use a third-party BI offering to visualize application data, instead of building custom reporting. An advantage is that users viewing the content do not need any kind of Power BI licenses assigned to them. It also allows you to use your own branding.
Power BI embedded is based on a capacity licensing model and so the cost of the license will depend on the usage. It is possible to pause the service, which means the embedded content will not load, and you will not be charged for the service.
How do I create a data gateway in Power BI?
A data gateway is an application that is used to provide a secure data transfer connection between cloud based Power BI service and the data source located on-premises (data that isn’t on the cloud). It works with Power BI and other cloud services like Power Apps, Power Automate, Azure Logic Apps etc. There are two different types of data gateways – Personal and Standard, both of which are free to use. Personal mode is generally suitable for single-person use and can only be used with Power BI. This gateway is well-suited to scenarios where you’re the only person who creates reports, and you don’t need to share any data sources with others. Standard is usually used for a collaborative environment. You can use this data gateway and all supported services, with a single gateway installation. This gateway is well-suited to complex scenarios with multiple people accessing multiple data sources. More information on the differences between the two can be found here.
A gateway can be installed on any servers in a local domain. Download and install the gateway by following these simple steps. Then sign in with your organization account to register the gateway to be used by cloud services. Our team is very experienced in setting up data gateways for Power BI and can assist quickly and simply if you require any support.
Does Power BI use DAX?
DAX stands for Data Analysis Expressions. DAX is a language that was created specifically for handling data models, through the use of formulas and expressions. DAX is used in several Microsoft Products such as Microsoft Power BI, Microsoft Analysis Services and Microsoft Power Pivot for Excel. Although Power BI is much more than DAX, it will help unleash the capabilities of Power BI. You can build smarter dashboards and perform complex calculations. It is important to have a good understanding of DAX in order to be able to fully benefit from Power BI.
What is a data model in Power BI?
Often, you’ll will want to use data from multiple data sources, when creating Power BI reports. To be able to use this data in combination and in a meaningful way, we need to integrate the data into one consistent data model. A data model in power BI organises data elements and defines how the data elements relate to one another. When creating the data model a number of tasks will be completed, such as:
- Defining the relationships between various source data sets
- Calculating any new fields from existing data columns
- Cleaning up data in order to stream line the data model
- Creating any new measures that are required for analysis
- Ensuring that time-based data is appropriately formatted

